phytools : plotTree.wBars
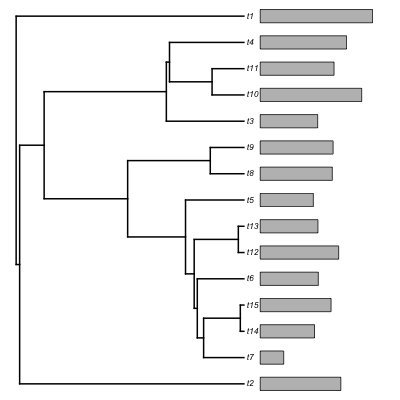
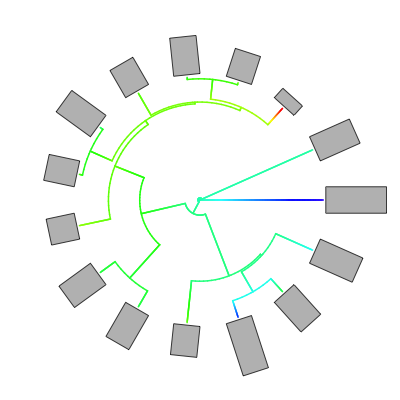
RのパッケージphytoolsのコマンドplotTree.wBarsでは、系統樹の隣に各種の形質値を表す棒グラフを並列できる。
---------------------------------------
library(phytools)
Tree<-pbtree(n=15)
x<-c(runif(15))
labels<-c("t1", "t2", "t3", "t4", "t5", "t6", "t7", "t8", "t9", "t10", "t11", "t12", "t13", "t14", "t15")
names(x)<-labels
contTree<-contMap(Tree, x, res=100)
###サンプル系統樹に形質値をのせる
plotTree.wBars(contTree$tree, x, method="plotTree", tip.labels=TRUE, fsize=0.7, colors=contTree$cols, type="phylogram")
###系統樹と棒グラフを並列する
---------------------------------------

---------------------------------------
plotTree.wBars(contTree$tree, x, method="plotSimmap", tip.labels=FALSE, fsize=0.7, colors=contTree$cols, type="fan")
###methodで系統樹の枝の色付けが可能
###tip.labelで種名の有無を設定可能
###typeで系統樹の形が変更可能
---------------------------------------

参考 : Plotting methods for comparative data and phylogenies